Visualization
The visualization module provides a variety of functions to visualize initial, intermediate and final datasets within trackintel.
Positionfixes
-
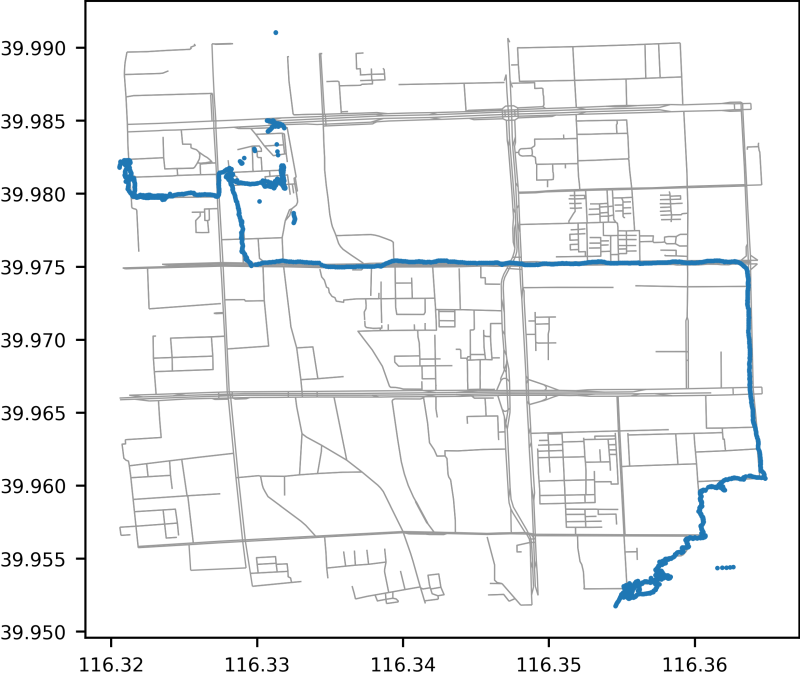
trackintel.visualization.positionfixes.plot_positionfixes(positionfixes, out_filename=None, plot_osm=False)¶ Plots positionfixes (optionally to a file). If you specify
plot_osm=Truethis will useosmnxto plot streets below the positionfixes. Depending on the extent of your data, this might take a long time.- Parameters
Examples
>>> df.as_positionfixes.plot('output.png', plot_osm=True)
Staypoints
-
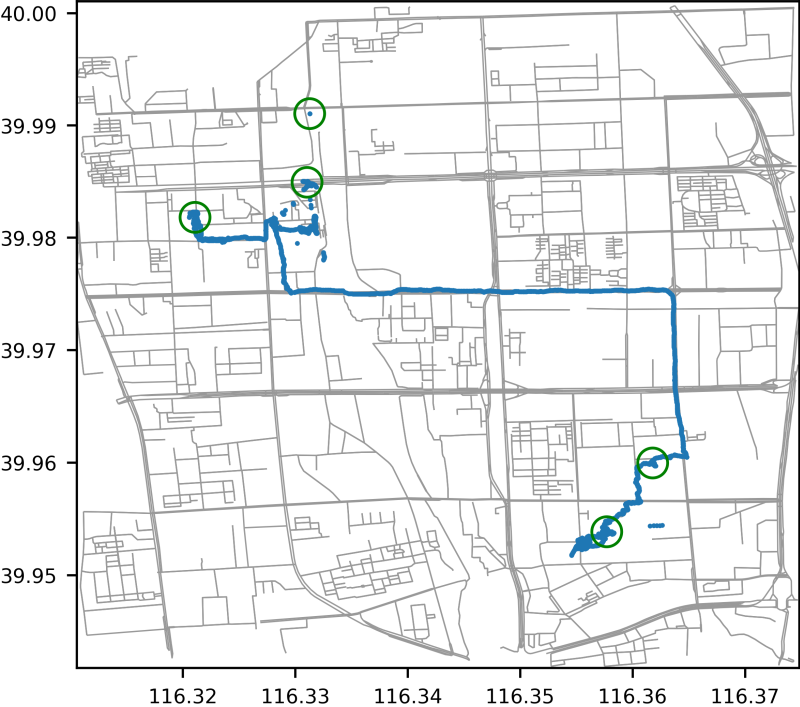
trackintel.visualization.staypoints.plot_staypoints(staypoints, out_filename=None, radius=None, positionfixes=None, plot_osm=False)¶ Plots staypoints (optionally to a file). You can specify the radius with which each staypoint should be drawn, as well as if underlying positionfixes and OSM streets should be drawn.
- Parameters
staypoints (GeoDataFrame) – The staypoints to plot.
out_filename (str, optional) – The file to plot to, if this is not set, the plot will simply be shown.
radius (float, optional) – The radius with which circles around staypoints should be drawn.
positionfixes (GeoDataFrame, optional) – If available, some positionfixes that can additionally be plotted.
plot_osm (bool, default False) – If this is set to True, it will download an OSM street network and plot below the staypoints.
Examples
>>> df.as_staypoints.plot('output.png', radius=10, positionfixes=pdf, plot_osm=True)
Triplegs
Locations
-
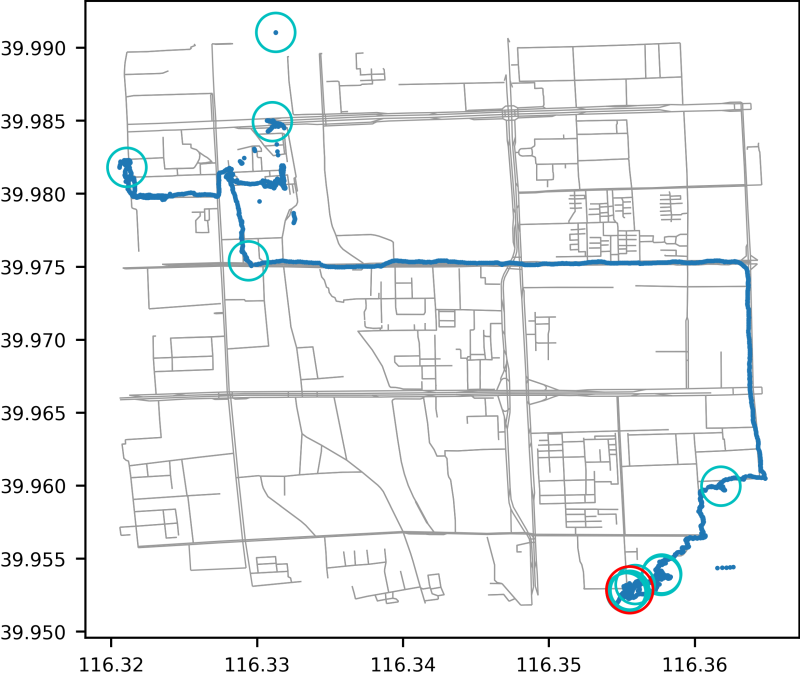
trackintel.visualization.locations.plot_center_of_locations(locations, out_filename=None, radius=None, positionfixes=None, staypoints=None, staypoints_radius=None, plot_osm=False)¶ Plots locations (optionally to a file). Optionally, you can specify several other datasets to be plotted beneath the locations.
- Parameters
locations (GeoDataFrame) – The locations to plot.
out_filename (str, optional) – The file to plot to, if this is not set, the plot will simply be shown.
radius (float, optional) – The radius with which circles around locations should be drawn.
positionfixes (GeoDataFrame, optional) – If available, some positionfixes that can additionally be plotted.
staypoints (GeoDataFrame, optional) – If available, some staypoints that can additionally be plotted.
plot_osm (bool, default False) – If this is set to True, it will download an OSM street network and plot below the staypoints.
Examples
>>> df.as_locations.plot('output.png', radius=10, positionfixes=pdf,
>>>                   staypoints=spf, staypoints_radius=8, plot_osm=True)