Visualization
The visualization module provides a variety of functions to visualize initial, intermediate and final datasets within trackintel.
Positionfixes
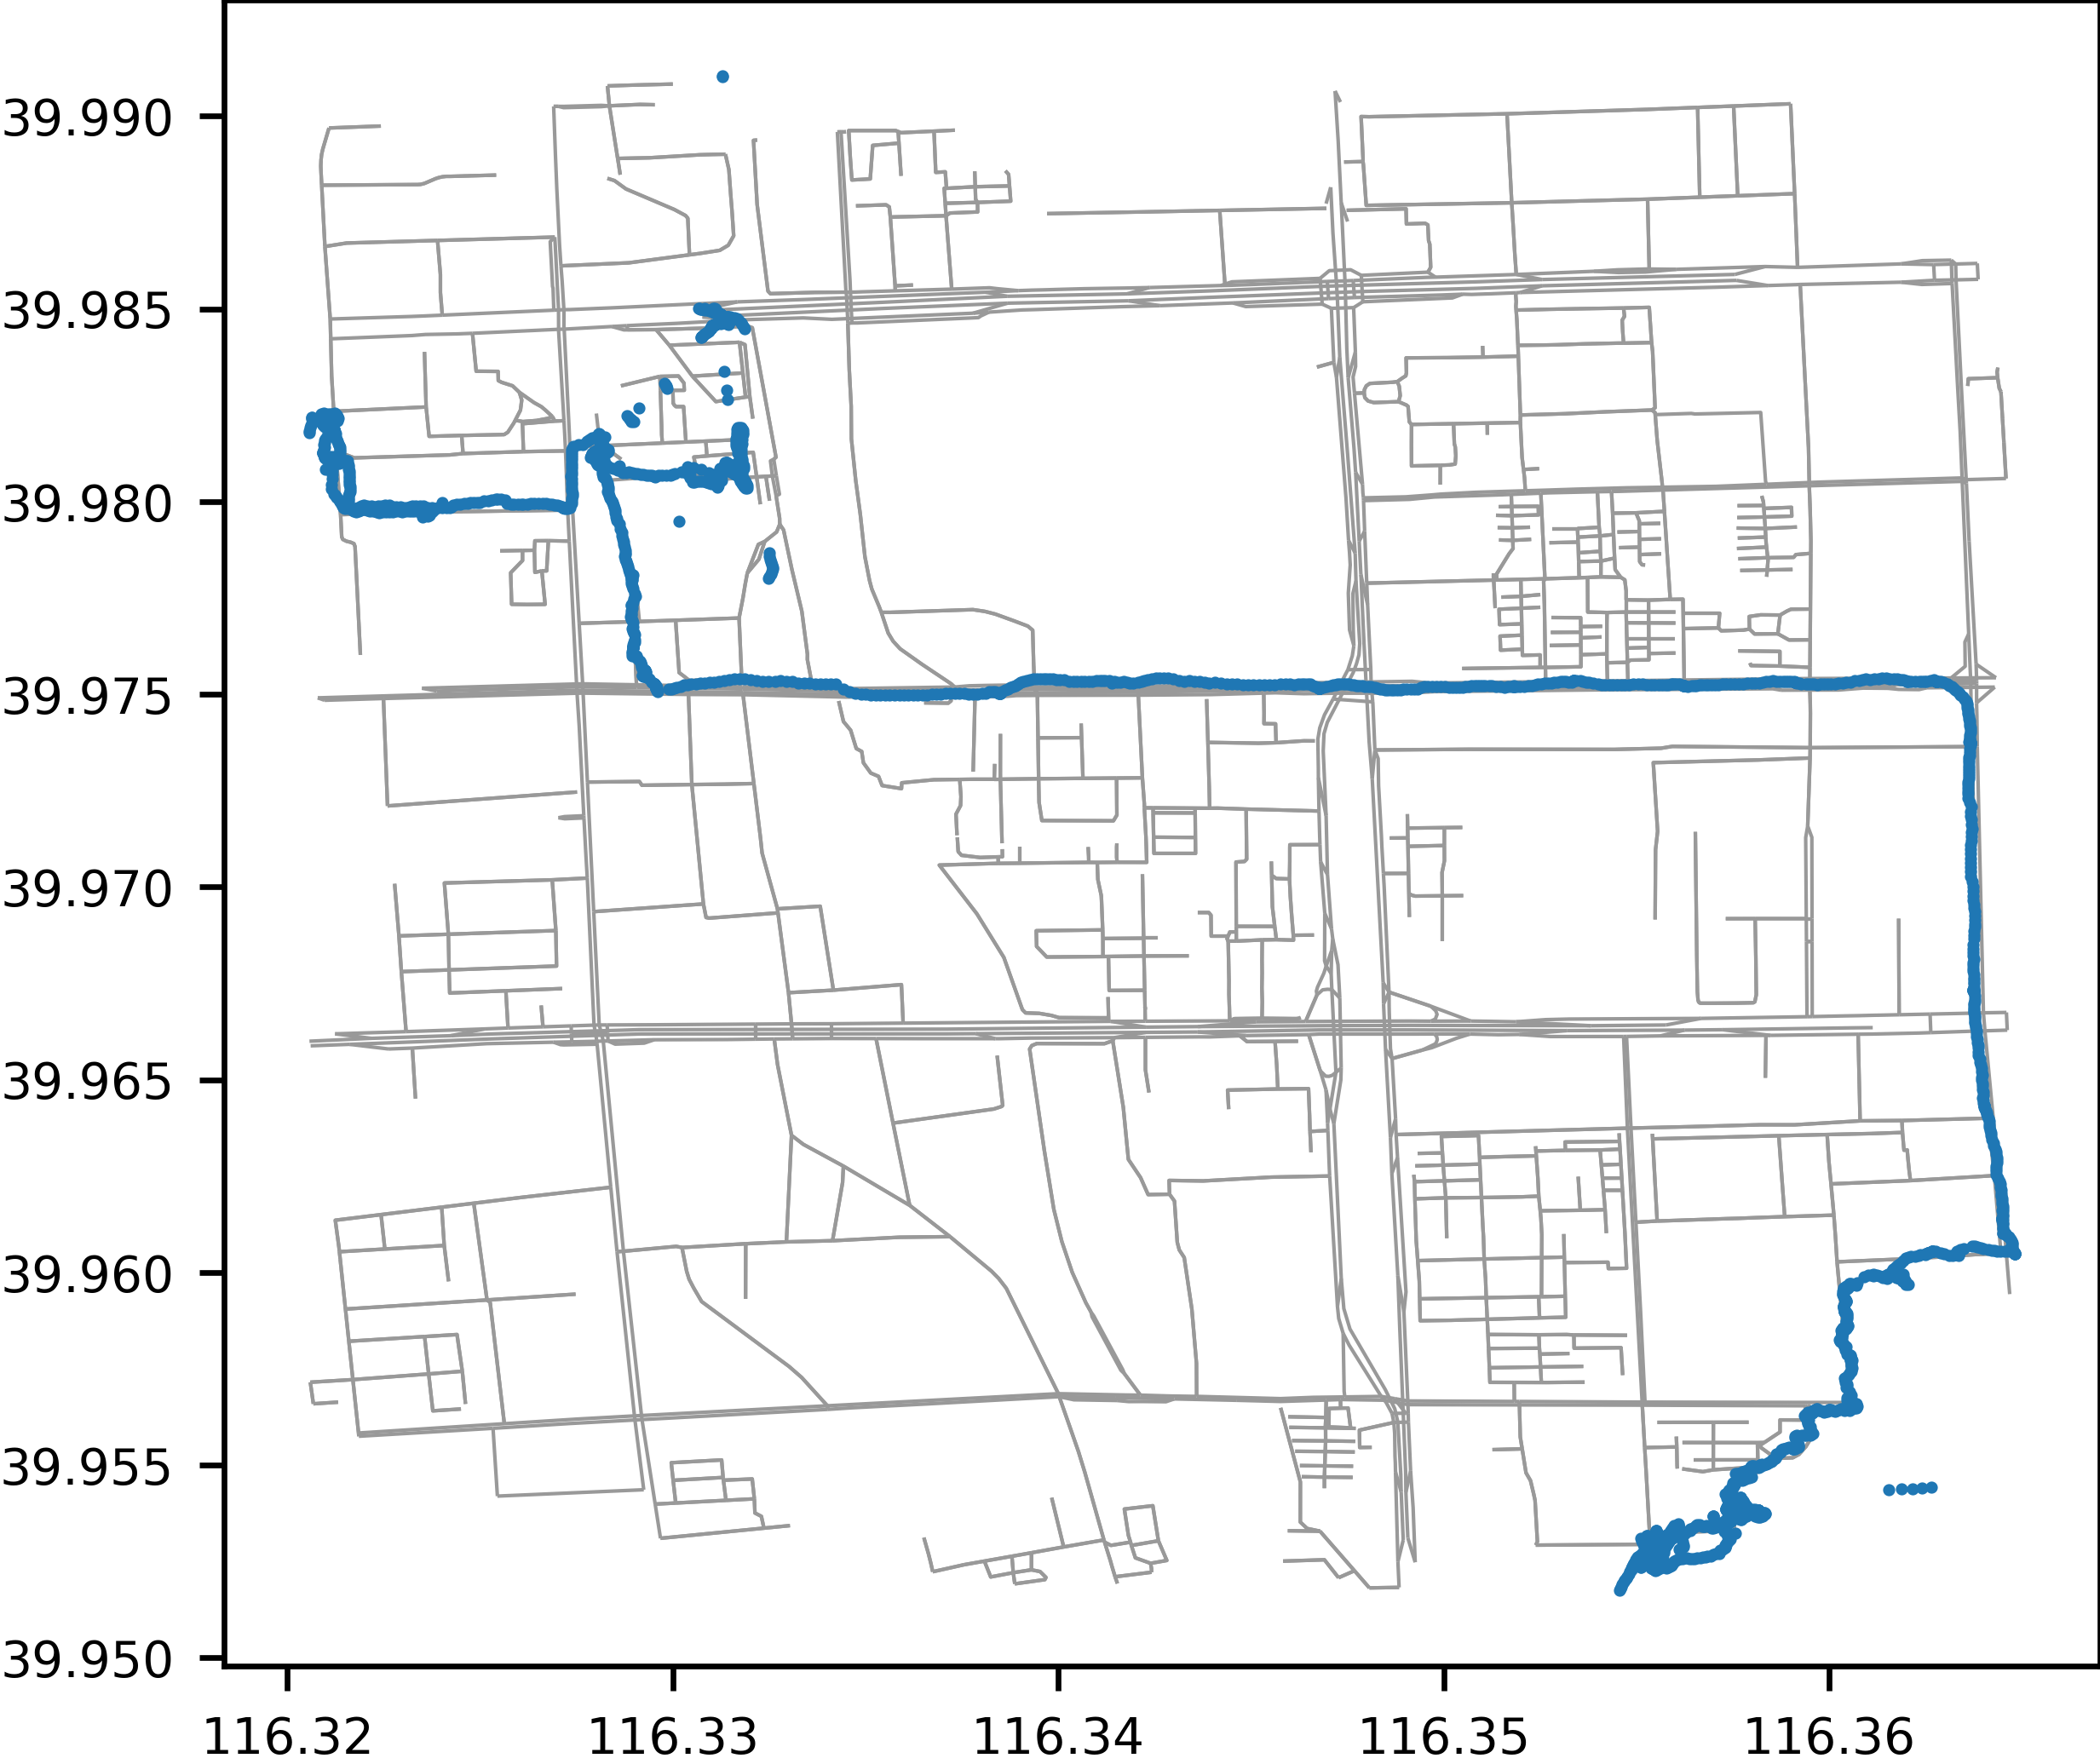
- trackintel.visualization.positionfixes.plot_positionfixes(positionfixes, out_filename=None, plot_osm=False, axis=None)[source]
Plots positionfixes (optionally to a file).
If you specify
plot_osm=Truethis will useosmnxto plot streets below the positionfixes. Depending on the extent of your data, this might take a long time. The data gets transformed to wgs84 for the plotting.- Parameters
positionfixes (GeoDataFrame (as trackintel positionfixes)) – The positionfixes to plot.
out_filename (str, optional) – The file to plot to, if this is not set, the plot will simply be shown.
plot_osm (bool, default False) – If this is set to True, it will download an OSM street network and plot below the staypoints.
axis (matplotlib.pyplot.Artist, optional) – axis on which to draw the plot
Examples
>>> pfs.as_positionfixes.plot('output.png', plot_osm=True)
Staypoints
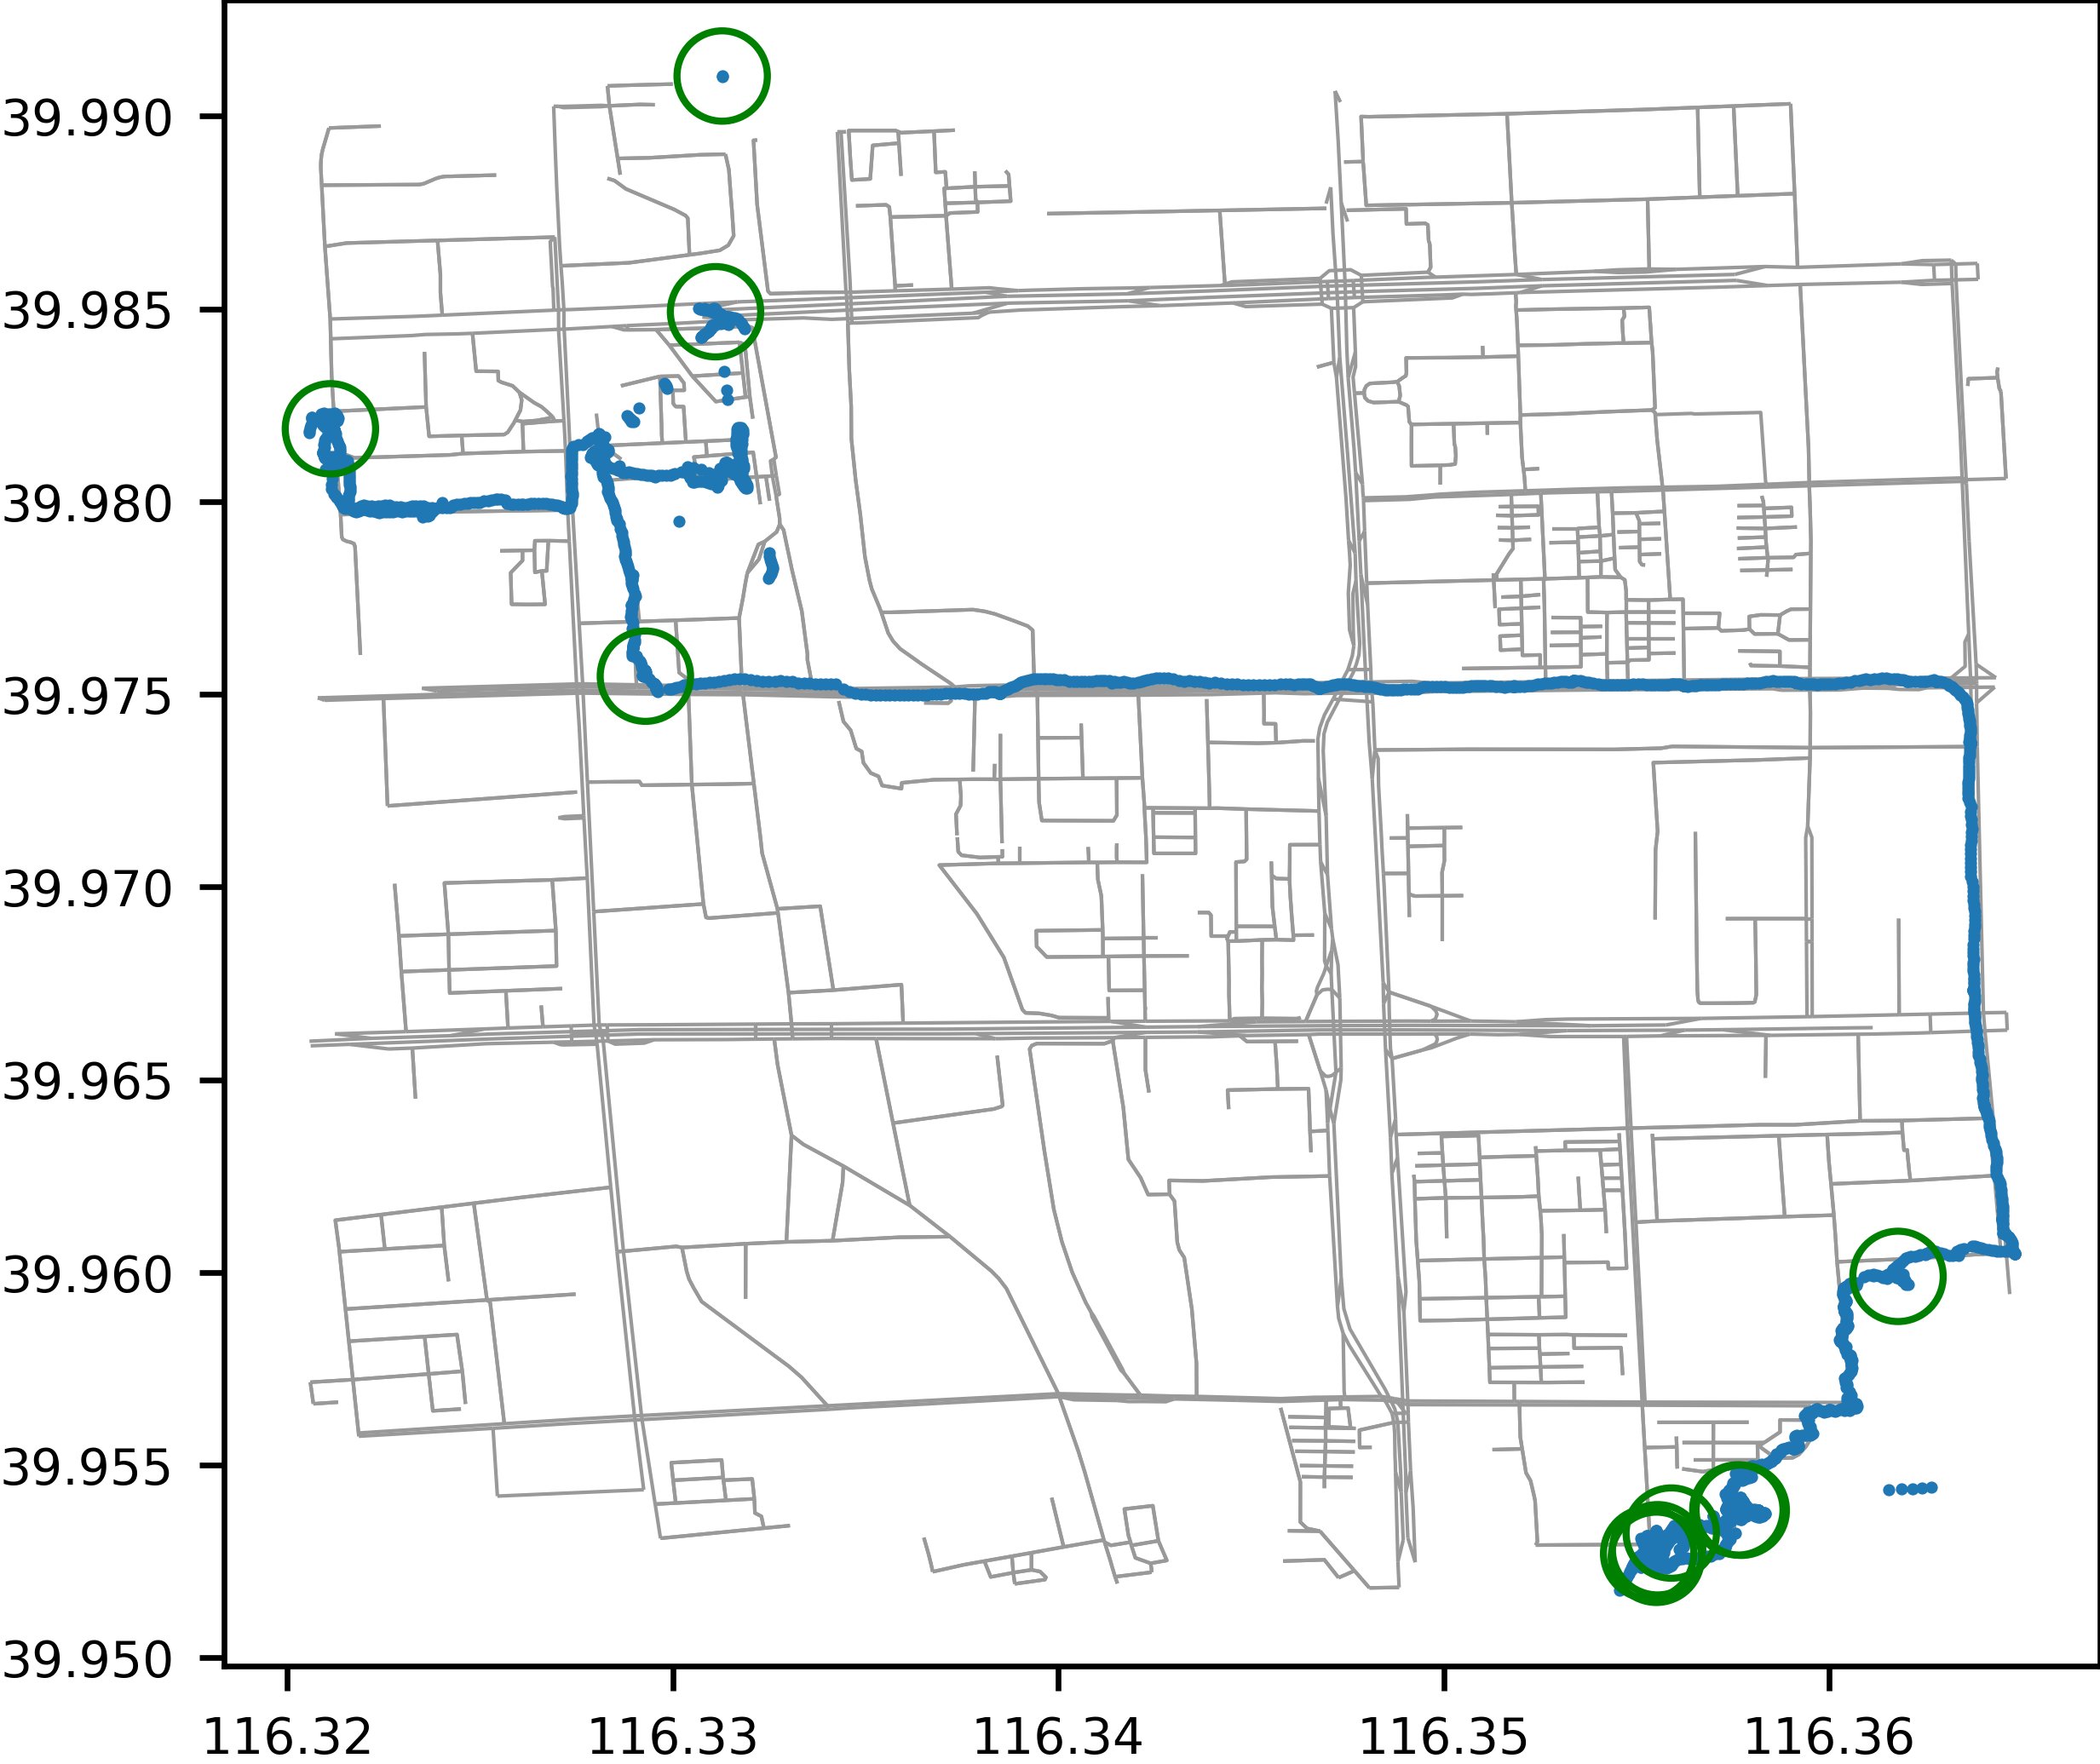
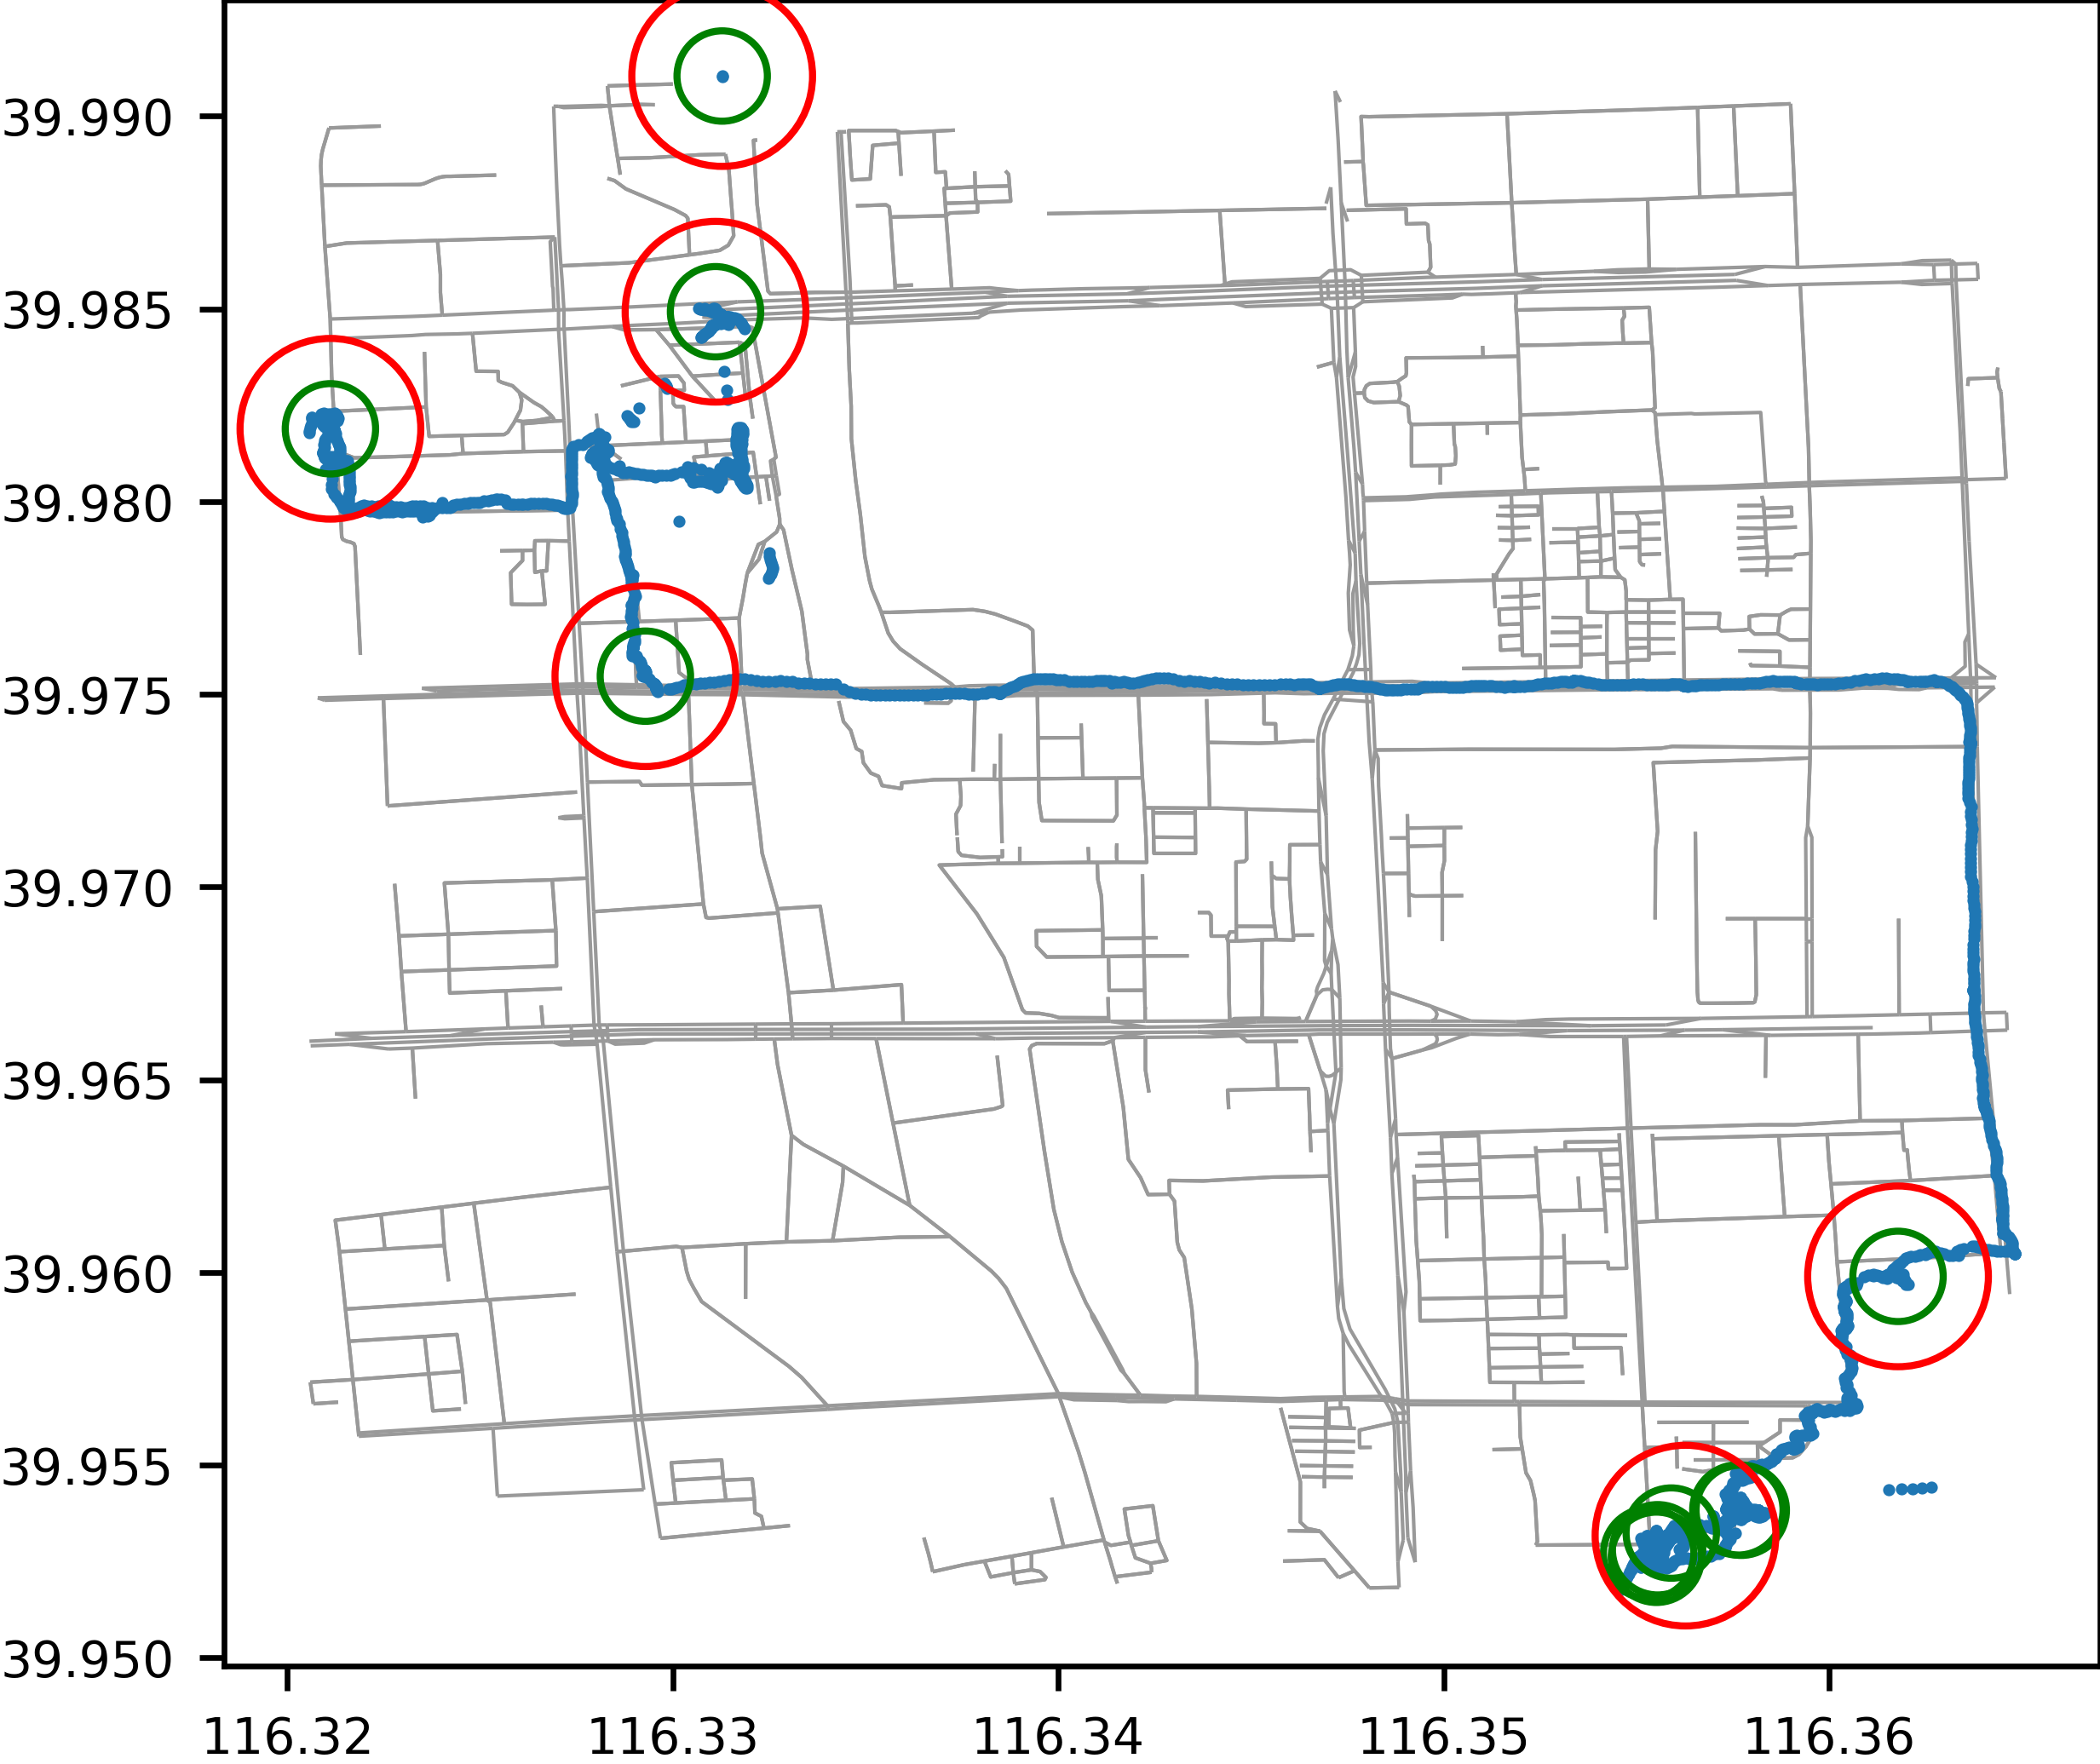
- trackintel.visualization.staypoints.plot_staypoints(staypoints, out_filename=None, radius=100, positionfixes=None, plot_osm=False, axis=None)[source]
Plot staypoints (optionally to a file).
You can specify the radius with which each staypoint should be drawn, as well as if underlying positionfixes and OSM streets should be drawn. The data gets transformed to wgs84 for the plotting.
- Parameters
staypoints (GeoDataFrame (as trackintel staypoints)) – The staypoints to plot.
out_filename (str, optional) – The file to plot to, if this is not set, the plot will simply be shown.
radius (float, default 100 (meter)) – The radius in meter with which circles around staypoints should be drawn.
positionfixes (GeoDataFrame (as trackintel positionfixes), optional) – If available, some positionfixes that can additionally be plotted.
plot_osm (bool, default False) – If this is set to True, it will download an OSM street network and plot below the staypoints.
axis (matplotlib.pyplot.Artist, optional) – axis on which to draw the plot
Examples
>>> sp.as_staypoints.plot('output.png', radius=100, positionfixes=pfs, plot_osm=True)
Triplegs
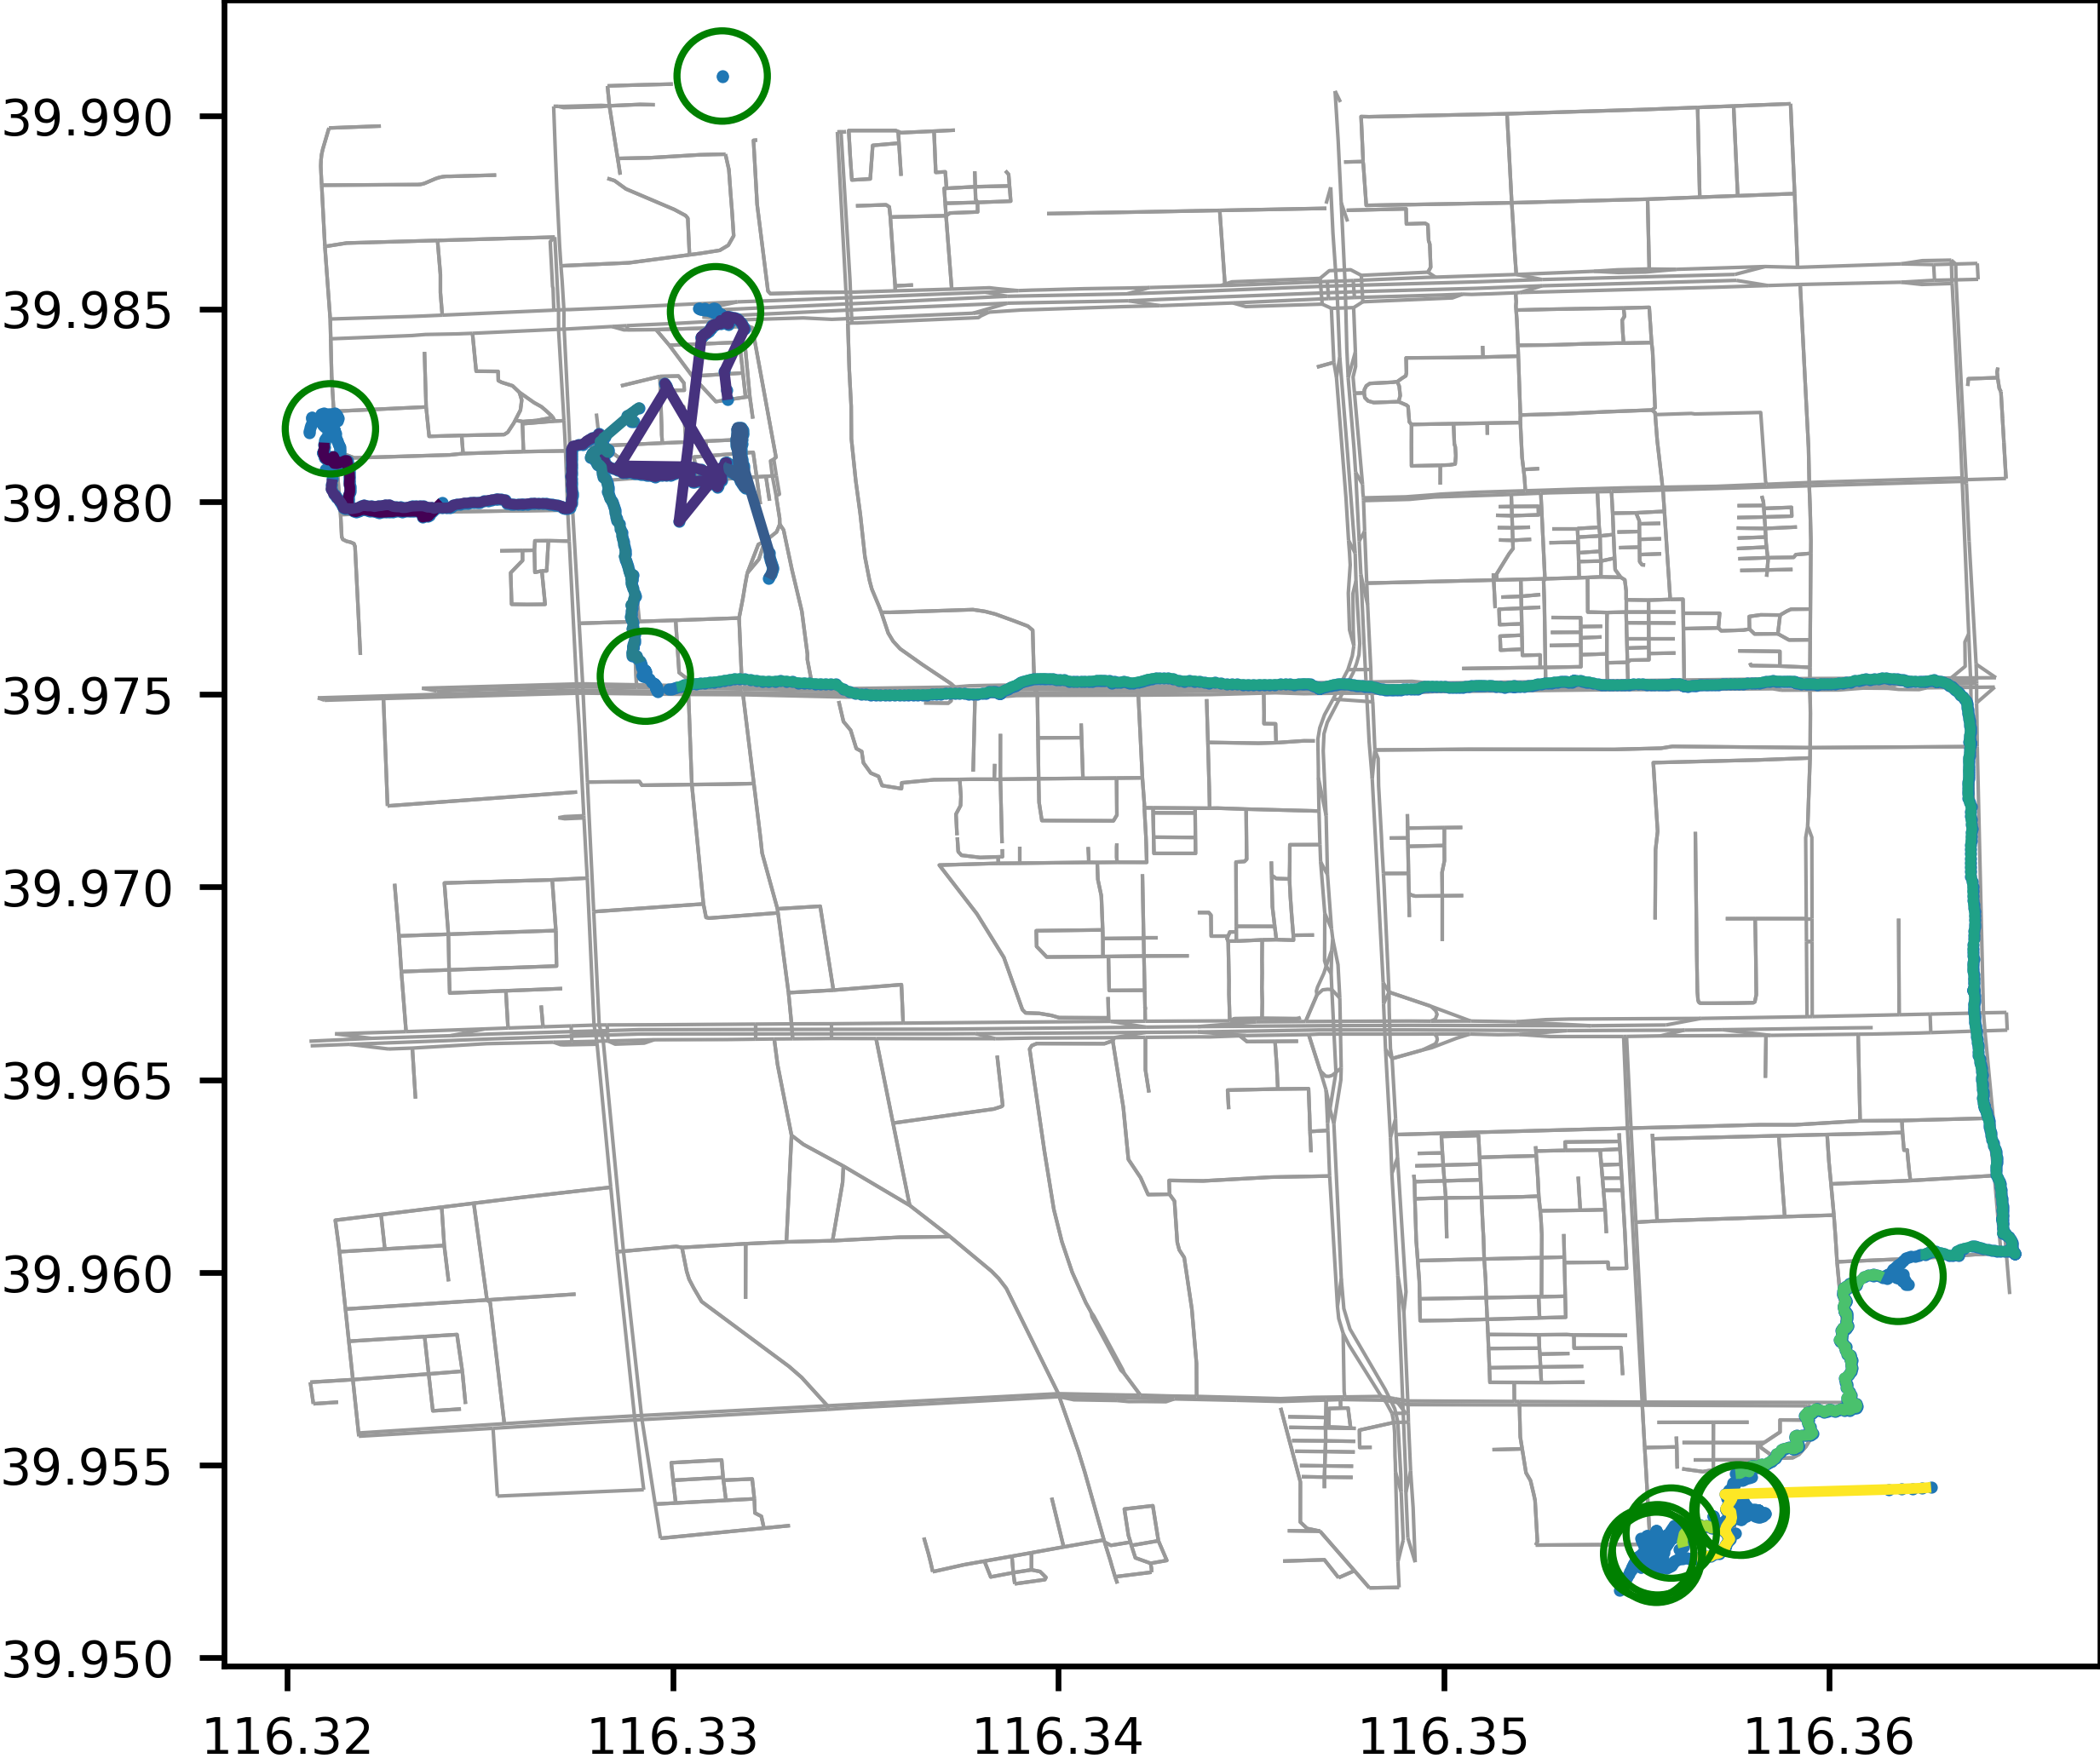
- trackintel.visualization.triplegs.plot_triplegs(triplegs, out_filename=None, positionfixes=None, staypoints=None, staypoints_radius=100, plot_osm=False, axis=None)[source]
Plot triplegs (optionally to a file).
You can specify several other datasets to be plotted beneath the triplegs, as well as if the OSM streets should be drawn. The data gets transformed to wgs84 for the plotting.
- Parameters
triplegs (GeoDataFrame (as trackintel triplegs)) – The triplegs to plot.
out_filename (str, optional) – The file to plot to, if this is not set, the plot will simply be shown.
positionfixes (GeoDataFrame (as trackintel positionfixes), optional) – If available, some positionfixes that can additionally be plotted.
staypoints (GeoDataFrame (as trackintel staypoints), optional) – If available, some staypoints that can additionally be plotted.
staypoints_radius (float, default 100 (meter)) – The radius in meter with which circles around staypoints should be drawn.
plot_osm (bool, default False) – If this is set to True, it will download an OSM street network and plot below the triplegs.
axis (matplotlib.pyplot.Artist, optional) – axis on which to draw the plot
Example
>>> tpls.as_triplegs.plot('output.png', positionfixes=pfs, staypoints=sp, plot_osm=True)
Locations
- trackintel.visualization.locations.plot_locations(locations, out_filename=None, radius=150, positionfixes=None, staypoints=None, staypoints_radius=100, plot_osm=False, axis=None)[source]
Plot locations (optionally to a file).
Optionally, you can specify several other datasets to be plotted beneath the locations.
- Parameters
locations (GeoDataFrame (as trackintel locations)) – The locations to plot.
out_filename (str, optional) – The file to plot to, if this is not set, the plot will simply be shown.
radius (float, default 150 (meter)) – The radius in meter with which circles around locations should be drawn.
positionfixes (GeoDataFrame (as trackintel positionfixes), optional) – If available, some positionfixes that can additionally be plotted.
staypoints (GeoDataFrame (as trackintel staypoints), optional) – If available, some staypoints that can additionally be plotted.
staypoints_radius (float, default 100 (meter)) – The radius in meter with which circles around staypoints should be drawn.
plot_osm (bool, default False) – If this is set to True, it will download an OSM street network and plot below the staypoints.
axis (matplotlib.pyplot.Artist, optional) – axis on which to draw the plot
Examples
>>> locs.as_locations.plot('output.png', radius=200, positionfixes=pfs, staypoints=sp, plot_osm=True)
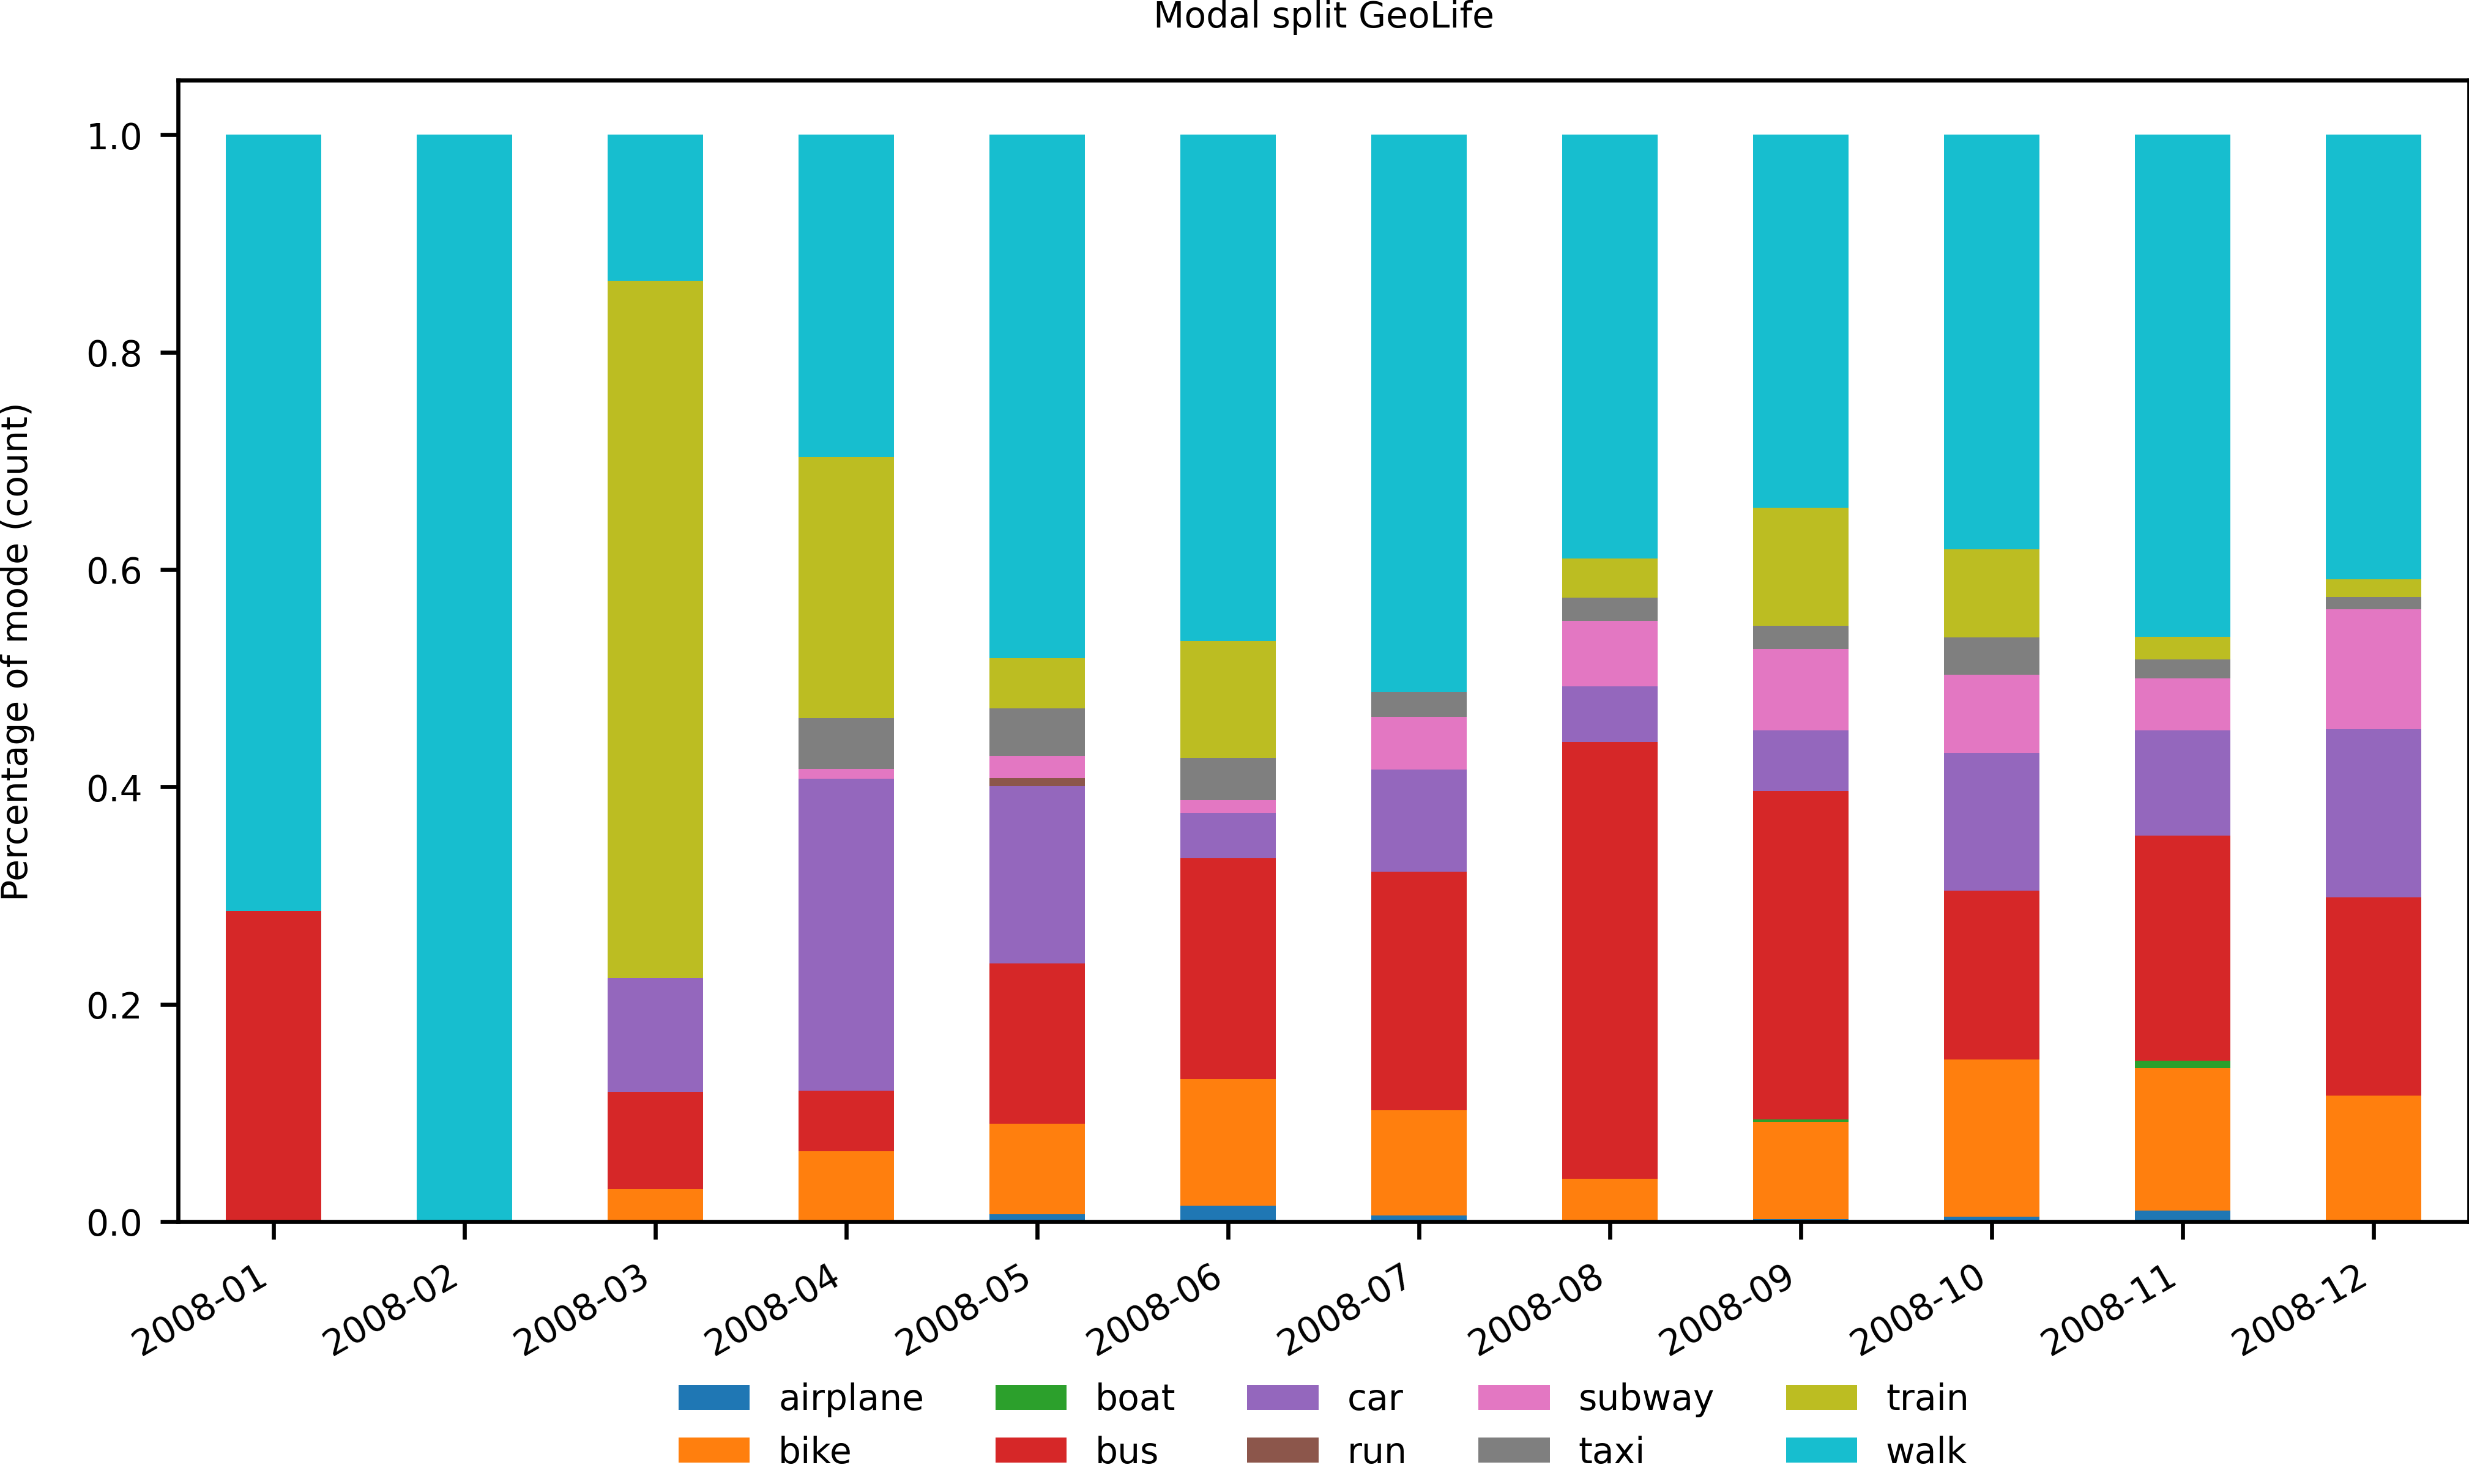
Modal split
- trackintel.visualization.modal_split.plot_modal_split(df_modal_split_in, out_path=None, date_fmt_x_axis='%W', fig=None, axis=None, title=None, x_label=None, y_label=None, x_pad=10, y_pad=10, title_pad=1.02, skip_xticks=0, n_col_legend=5, borderaxespad=0.5)[source]
Plot modal split as returned by trackintel.analysis.modal_split.calculate_modal_split
- Parameters
df_modal_split (DataFrame) – DataFrame with modal split information. Format is
out_path (str, optional) – Path to store the figure
date_fmt_x_axis (str, default: '%W') – strftime() date format code that is used for the x-axis
title (str, optional) –
x_label (str, optional) –
y_label (str, optional) –
fig (matplotlib.figure) – Only used if axis is provided as well.
axis (matplotlib axes) –
x_pad (float, default: 10) – Used to set ax.xaxis.labelpad
y_pad (float, default: 10) – Used to set ax.yaxis.labelpad
title_pad (float, default: 1.02) – Passed on to matplotlib.pyplot.title
skip_xticks (int, default: 1) – Every nth x-tick label is kept.
n_col_legend (int) – Passed on as ncol to matplotlib.pyplot.legend()
borderaxespad (float) – Passed on to matplotlib.pyplot.legend()
- Returns
fig (Matplotlib figure handle)
ax (Matplotlib axis handle)
Examples
>>> modal_split = calculate_modal_split(triplegs, metric='count', freq='D', per_user=False)
>>> plot_modal_split(modal_split, out_path=tmp_file, date_fmt_x_axis='%d',
>>>                  y_label='Percentage of daily count', x_label='days')